
EURUSD
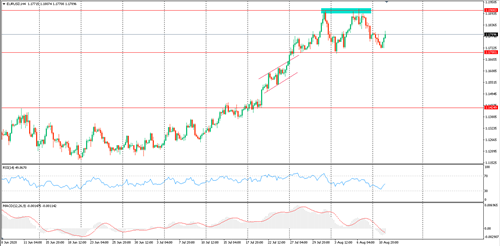
This pair is still trading in a sideways channel between $1.1700 support and 1.1900 resistance.
If it breaks through the resistance at 1.19 from the upside, the pair could continue towards 1.20-1.2050.
On the downside, if it breaches the support level of $1.1700, it could push the pair towards 1.1600 levels.
GBPUSD
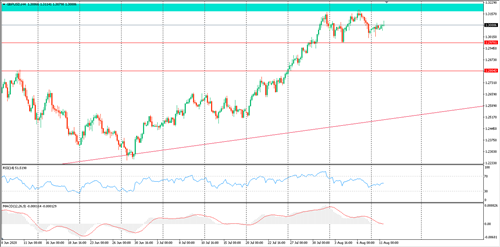
This pair is trading in a sideways channel between $1.2980 support and 1.3200 resistance.
If the pair falls back and breaches 1.2980, the pair could be vulnerable towards 1.2800.
On the top side, if it breaks through the resistance of 1.32, the pair could target 1.3350-1.3500.
.
USDJPY
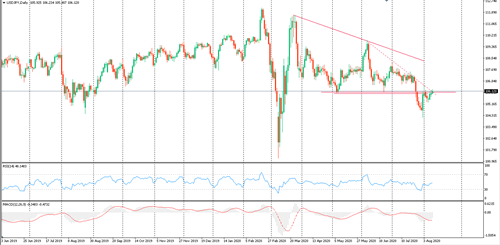
This pair successfully stabilised above 106.00, and it is expected to target 107.50-108.20. Support levels to watch are 106.00-105.30.
Gold (XAUUSD)
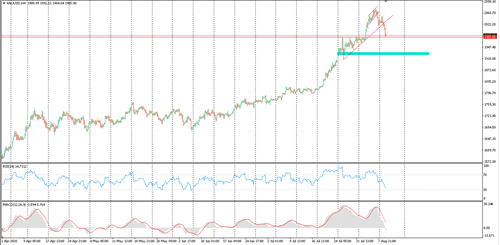
Gold retreated to $1863 per ounce, which represents rising trend line support for a ‘Bomb and Run’ pattern, and it succeeded in bouncing from it to 1950 levels.
Our expectation is for gold to move within the narrowing bullish channel shown on the chart to the levels of 1980.
In the event of a reversal and a break of the 1907 support, gold may test the 1863 level again. If it breaks this, we may target 1750.
WTI (USOILROLL)
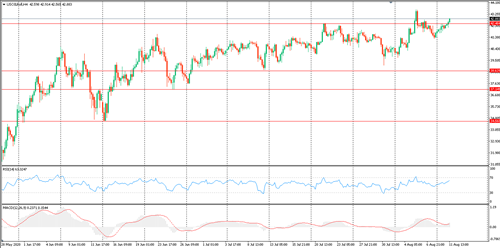
Oil is facing support levels at $41.70 per barrel. We expect it to bounce back from this level and then target 43.50 level. If there is any follow through, oil could target 45.00.
In the event of a breach of the 41.70 support, oil may fall to $40.50 and then 39.00.
Dow Jones
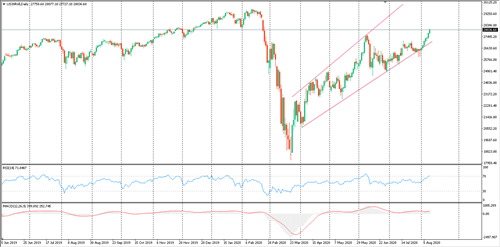
The Dow Jones is forming a triangle after the ascending movement it achieved during the previous session. If it surpasses the resistance level of 28150, the index will continue rising to 28500-29000 points.
The support level to watch is 27600; if it breaks it, the index may retreat to 27200 levels.